
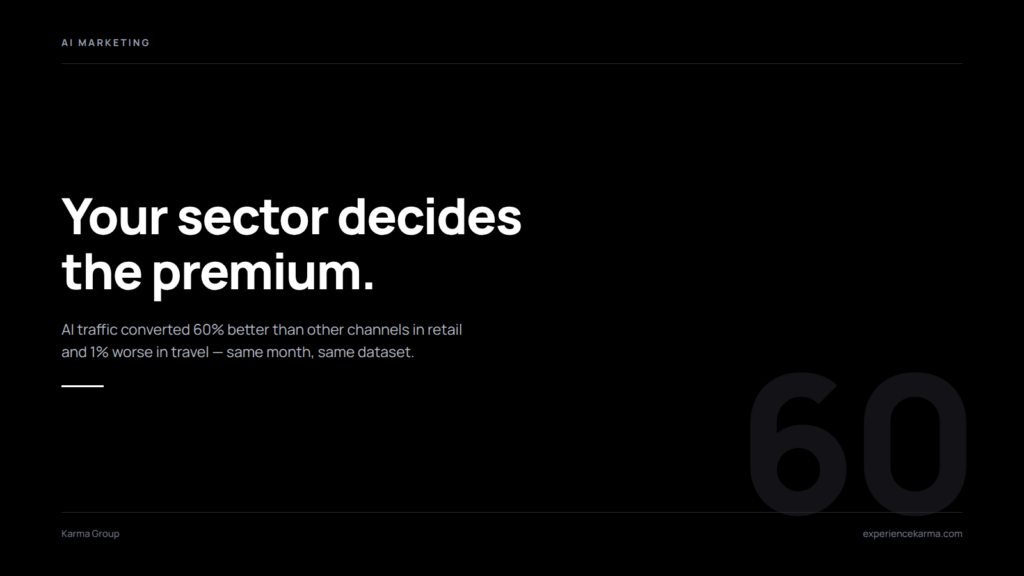
Adobe Digital Insights recorded a 60% AI traffic conversion advantage on retail sites in July 2026. In travel, during that same month, AI-referred visits converted 1% below every other channel. So the honest answer to “does AI traffic convert better” is that your sector decides. Retail earns a real premium right now. Travel does not. Because almost every article on this topic quotes the retail figure as a general fact, plenty of teams now measure themselves against a benchmark that was never theirs.
The gap is closing fast, though. That movement matters far more than the gap itself.
AI traffic conversion split by sector last month
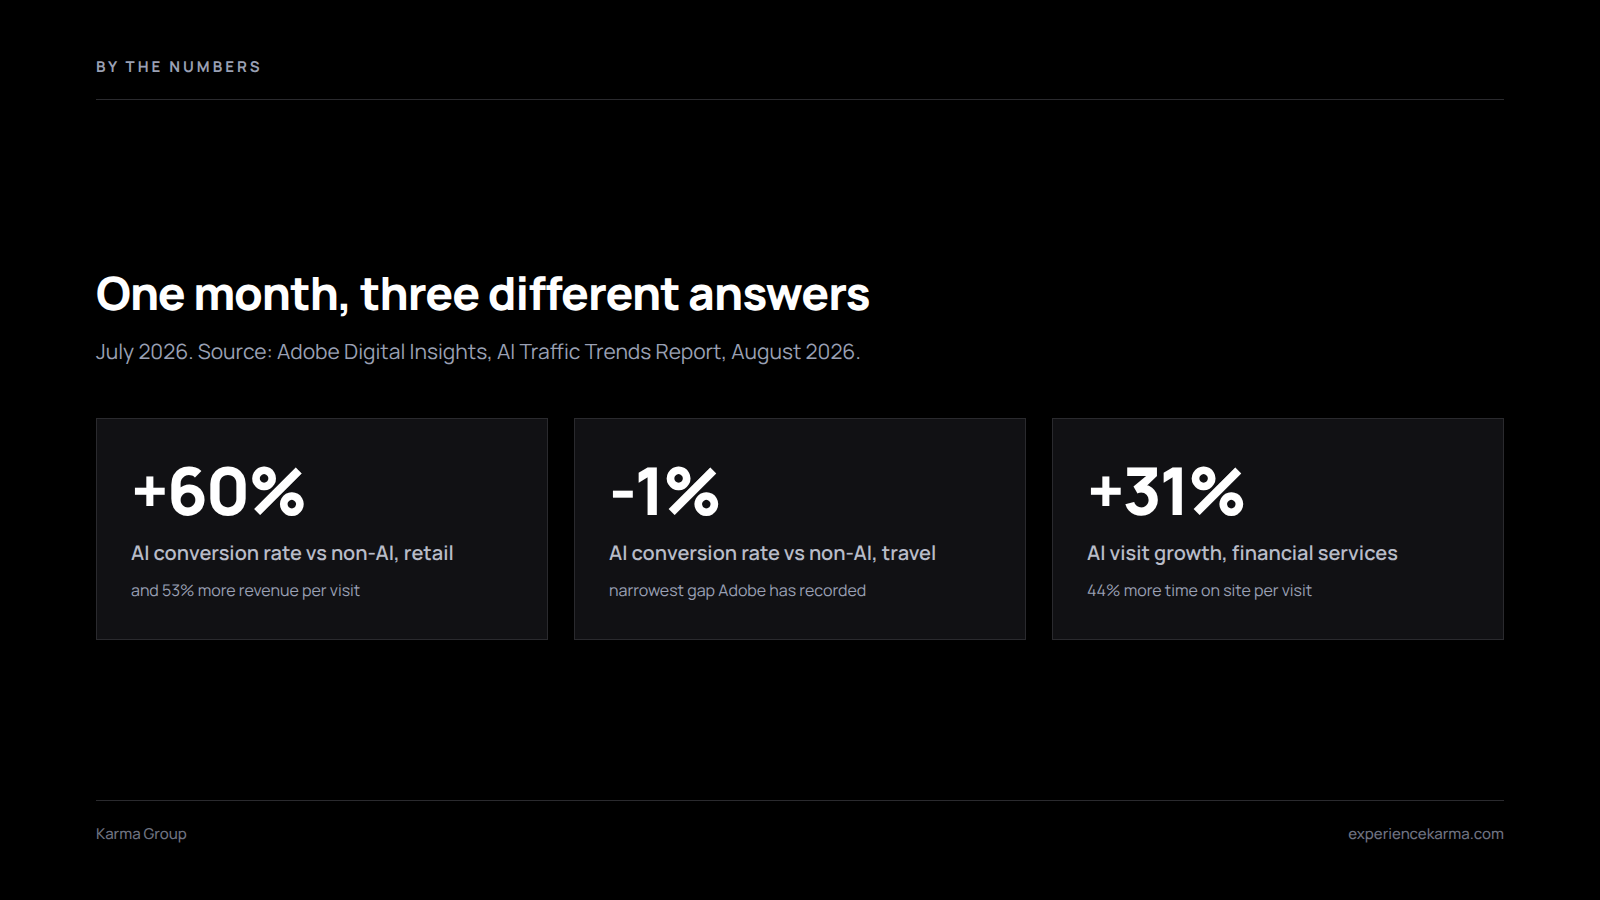
Adobe’s August 2026 AI Traffic Trends Report draws on more than a trillion visits to retail sites. In July 2026, AI-referred retail visitors converted 60% higher than non-AI traffic. They also generated 53% more revenue per visit. Twelve months earlier, the same report notes, non-AI visits were worth 128% more than AI visits. So retail did not simply gain an edge. Instead it erased a large deficit inside a single year.
Travel reads differently in that same dataset. AI-referred travel visits converted 1% lower than non-AI sources in July. That is the narrowest the travel gap has ever measured, but a gap it remains. Meanwhile financial services saw AI-driven visits grow 31% year over year, with visitors spending 44% more time per visit.
Travel closed a 27-point gap in two months
Back in May 2026, Adobe reported that AI-driven travel traffic converted 28% less than non-AI sources. By July that deficit had shrunk to 1%. Two months, 27 points.
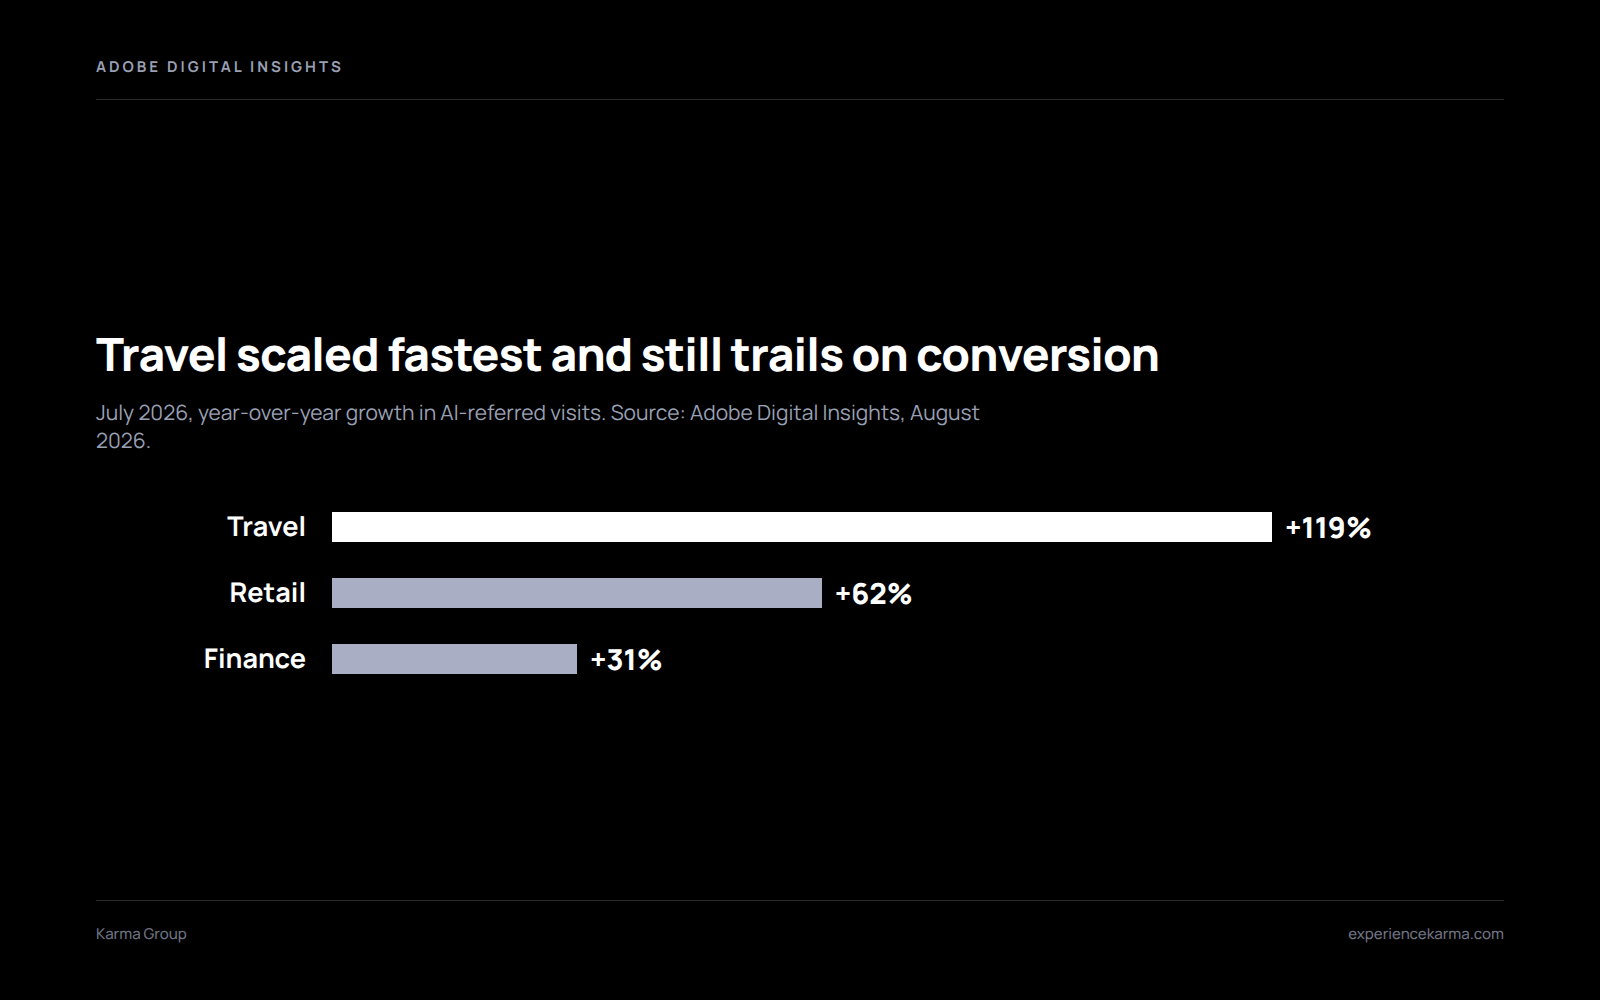
Travel also grew AI visit share faster than any other sector last month, at 119% year over year against 62% for retail. So travel is not broken. Travel is early. Anyone reading a travel dashboard against the 60% retail headline would conclude their site has a conversion problem. In fact they would be watching a curve that has not finished bending.
Retail crossed over a year ago and kept climbing
Retail ran the same course first, which is why it makes such a useful reference. In March 2025, AI traffic to retail sites converted 38% worse than non-AI traffic. By March 2026 it converted 42% better. By July 2026 the advantage had widened to 60%. Three readings, one clear direction.
Because of that curve, AI traffic conversion behaves less like a property of the channel and more like a position on a timeline. Sectors seem to start below parity. Then they cross it as assistants get better at handing off people who are ready to act. Retail crossed first because product questions resolve into a purchase quickly. Travel takes longer because a trip involves dates, seats, and two other people with opinions.
Engagement is not AI traffic conversion
Here is where teams get fooled. Engagement runs ahead of revenue everywhere, including in sectors where conversion still trails. In Adobe’s July figures, AI-referred retail visitors bounced 34% less than other traffic. Travel visitors stayed 67% longer on site. Financial services visitors spent 44% more time per visit. Yet travel still converted slightly below par that month.
So a glowing engagement report tells you very little about money. Longer sessions and lower bounce rates prove that assistants send you people who care. Those numbers do not prove that your checkout, your booking flow, or your quote form can finish the job.
Your pages are the AI traffic conversion bottleneck
Adobe ran its own audit of this in April 2026, scoring retail pages for machine readability out of 100%. Homepages averaged 75%. Category pages scored 74%. Product pages came last at 66%, which is exactly the page type where a purchase decision gets made. The spread between retailers was wider still: the strongest sites scored 82.5% and the weakest managed 54.2%.
That ordering should bother you. Assistants do the hardest part already, since they qualify the person and route them to you. Then the visitor lands on the least legible page you own. Our earlier look at where AI clicks actually land found the same mismatch from the traffic side.
Fixing this is unglamorous work. Put the specifics on the page in plain text rather than in a script-rendered tab. Name the product, the price, the availability, and the terms where both a person and a parser can read them. Skip the hero video.
The 60% figure will not survive contact with your dashboard
Most teams reading this will not see 60%. Some will see 5%. Others will see a deficit, and that is normal for their sector today. Three things move your reading away from the headline.
- Sector. Retail, travel, and financial services all sit at different points on the curve, per Adobe’s July data.
- Sample size. AI referrals still make up a thin slice of most sites, so a handful of orders swings the rate wildly.
- Attribution. Assistant apps often strip the referrer, so a share of your AI traffic lands in direct and never gets counted.
We covered that last problem in detail in our guide to measuring AI referral traffic in GA4. Fix attribution before you argue about benchmarks.
One more limit is worth naming. Adobe measures retail, travel, and financial services. It does not measure B2B lead generation, professional services, or anything with a 60-day sales cycle. So if you sell to businesses, treat every figure here as a directional signal rather than a target. Nobody has published good AI traffic conversion data for long-cycle B2B yet.
Benchmark AI traffic conversion against yourself, not the headline
Stop asking whether your AI traffic beats the industry number. Ask instead whether your own AI traffic converts better this quarter than last quarter, and whether the trend line points the way Adobe’s retail line pointed through 2025. A rising deficit is the real warning sign. A shrinking one means you are on the same path travel is walking now.
This also changes what you should fix. Since AI visitors already stay longer and bounce less, spending another month on engagement copy is largely wasted effort. The bottleneck sits later, at the step where intent turns into a transaction.
Set expectations upward too. Adobe’s retail line moved from a 38% deficit to a 60% advantage across sixteen months of readings. Travel moved 27 points in two. Numbers that swing that hard do not belong in an annual plan as fixed assumptions. Quote them with a date attached, every time, or someone will still be citing July 2026 next spring.
Do these five things before your next report
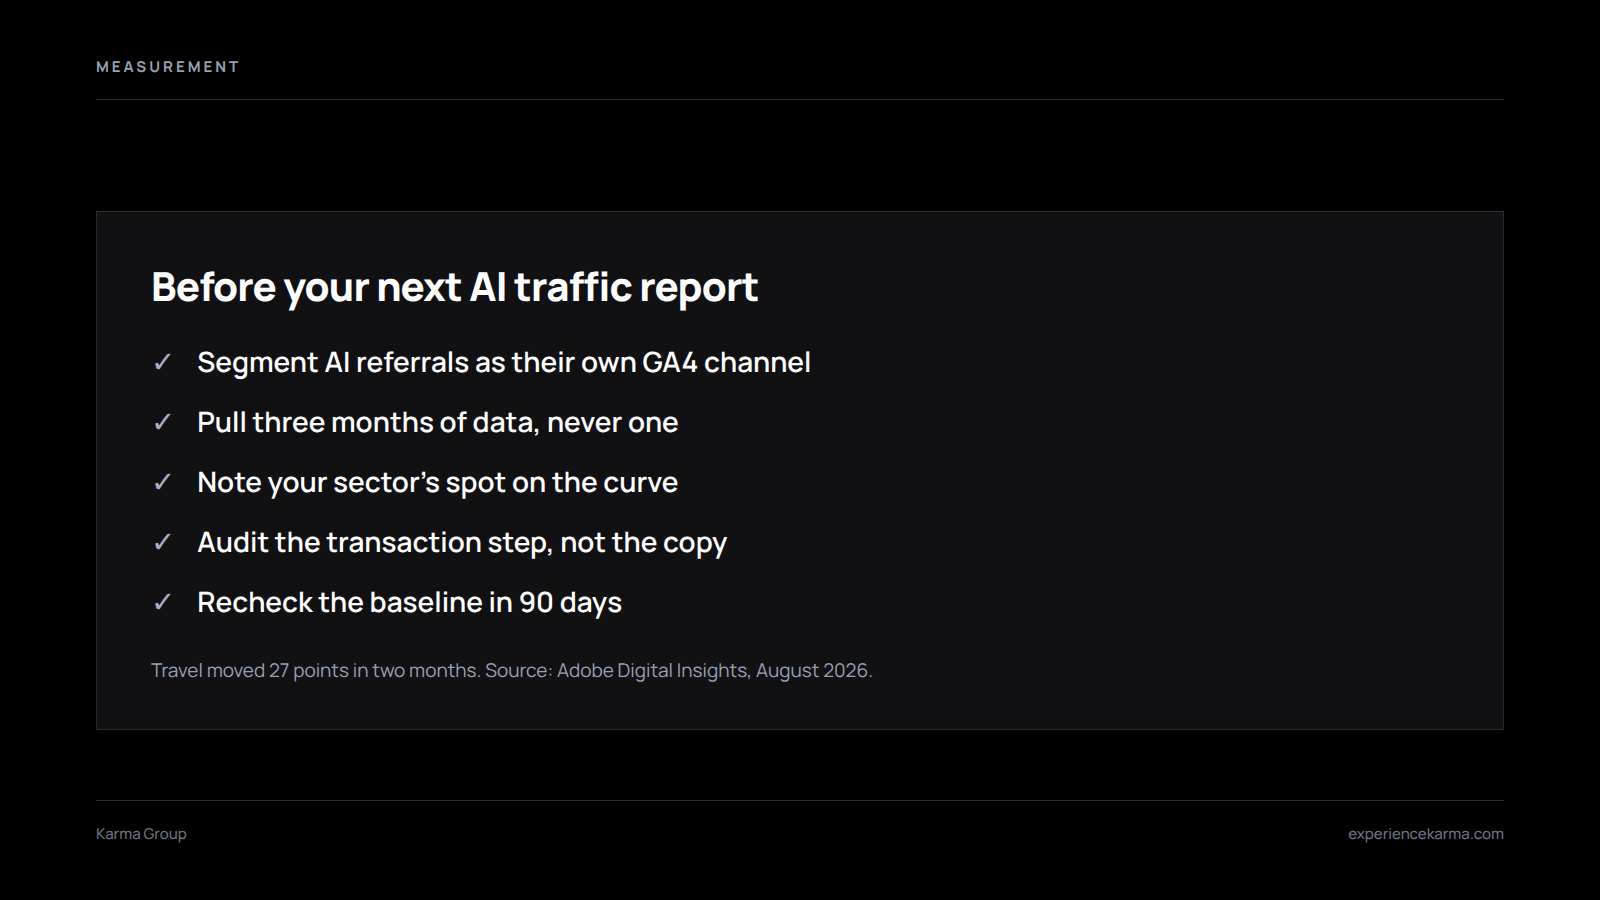
- Segment AI referrals as their own channel in GA4, then compare them only to your own prior periods.
- Pull three months of AI conversion rate, not one. A single month of thin traffic will mislead you.
- Note your sector’s position on the curve in the report itself, so nobody benchmarks retail numbers against a travel site.
- Audit the transaction step that AI visitors reach, because engagement is already strong before they get there.
- Recheck in 90 days. Travel moved 27 points in two months, so your baseline will age quickly.
Want help auditing your AI traffic conversion?
Karma Group builds AI search visibility and measurement programs for brands that need their numbers to mean something. If your AI referral data looks strange, we will tell you whether it is a tracking problem, a sector problem, or a real one. Get in touch and we will take a look.